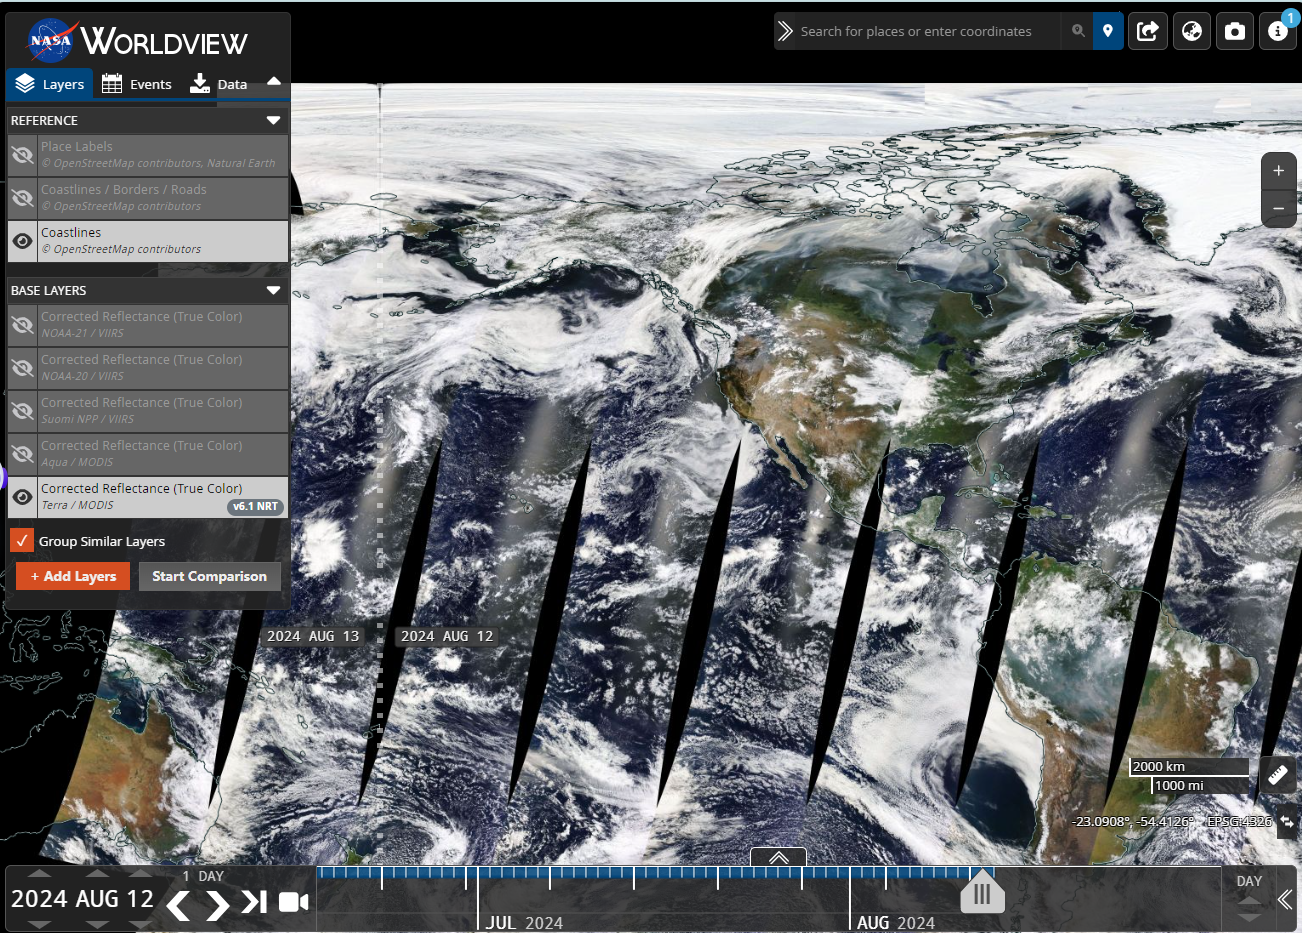
Remote sensing refers to non-contact, long-distance detection technologies, typically involving the use of sensors/remote sensing instruments to detect electromagnetic wave radiation and reflection characteristics of objects. As a crucial Earth observation technology, it provides primary data sources for studying and understanding the Earth's surface. Current remote sensing data exhibits coexistence of multi-source data types including high-medium-low resolution, multispectral, hyperspectral, SAR, street view, and LiDAR point clouds, offering fundamental data support for remote sensing monitoring and multidisciplinary applications.
The NASA satellite imagery data introduced by CnOpenData primarily archives data related to clouds, water vapor, and aerosols in Earth's atmosphere. The Earth is divided into 18×36 grids, with each 10×10-degree grid further partitioned into 2400×2400 units (each covering 500×500m). Numerical values represent regional light intensity, providing robust data support for relevant research.
Application Value
Satellite imagery data from the National Aeronautics and Space Administration (NASA) provides abundant information that facilitates our understanding of Earth's interconnected processes, develops innovative solutions for real-world challenges, and enables data-driven decision-making.
Primary applications include:
- Air Quality: Poor air quality constitutes one of the greatest global environmental and health threats. This data offers methods for predicting suboptimal air quality, tracking trace gases, visualizing air quality trends, and forecasting pollutant movement.
- Agriculture and Water Management: For agricultural and water resource managers, policymakers, and stakeholders interested in monitoring crop yields and water availability, this dataset provides NASA's terrestrial data, surface/groundwater data, and vegetation health indicators.
- Biodiversity and Ecological Conservation: For ecologists, conservation managers, and researchers monitoring biodiversity and predicting ecological community changes, this dataset delivers vegetation health metrics, spectral data, species distribution modeling data, and anthropogenic change monitoring tools.
- Disasters: Emergency managers and risk assessors can utilize this data to understand community vulnerabilities, monitor disaster precursors, quantify risks, implement mitigation strategies, and conduct post-event impact evaluations.
- Disease: While satellite sensors cannot directly detect disease transmission, they provide long-term environmental data records essential for analyzing environmental variables influencing vector habitats, seasonal patterns, and disease transmission suitability.
- Geographic Information Systems (GIS): GIS enables the analysis and visualization of georeferenced information from diverse sources to map and examine terrestrial changes.
- Greenhouse Gases: This dataset provides satellite, airborne, and ground-based measurements of climate-warming gases, including carbon dioxide, methane, nitrous oxide, ozone, chlorofluorocarbons, and water vapor.
- Sea Level Change: Urban planners and coastal managers can monitor glacial/ice sheet dynamics, oceanic processes, terrestrial water storage, and other factors driving sea level variations to assess associated risks and impacts.
- Water Quality: Water resource professionals can leverage this data to monitor local/global water bodies, identify ecological and human health impacts of water quality changes, and support coastal/surface water restoration efforts.
Temporal Coverage
April 2012-2024
Sample Data

Data Update Frequency
Annual updates