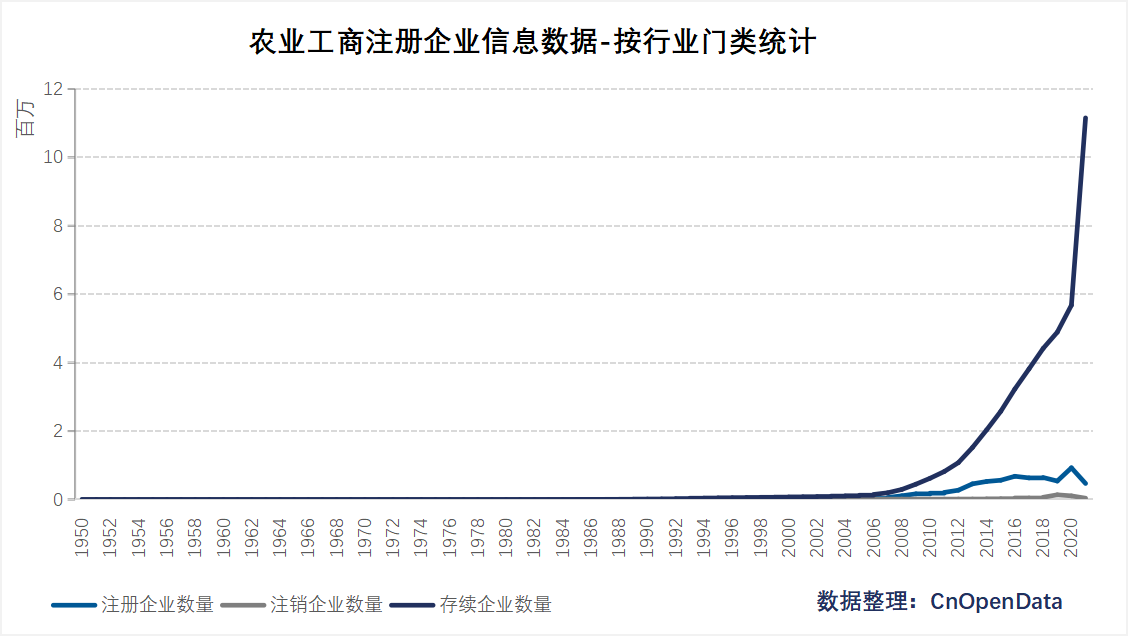
Introduction to statistical data on the number of registered agricultural industrial and commercial enterprises

 Agriculture refers to an important industry in the national economy. Agriculture refers to five industrial forms including planting, forestry, animal husbandry, fishery, and sideline industries; agriculture in the narrow sense refers to planting. Including production activities of crops such as food crops, cash crops, feed crops and green manure. The basic trends and characteristics of agricultural development in the contemporary world are a high degree of commercialization, capitalization, scale, specialization, regionalization, factoryization, knowledge, socialization, and internationalization intertwined, which has greatly increased the land output rate. , agricultural labor productivity, agricultural product commodity rate and international market competitiveness.

 Since the founding of the People's Republic of China in 1949, China's rural economy has rapidly recovered and developed, agricultural production conditions and production technology have been significantly improved, and output levels have increased rapidly. After more than 30 years of development, China has made great achievements by supporting almost one-fifth of the world's population with only 7% of the world's arable land. According to estimates by the Chinese Academy of Agricultural Sciences, the contribution rate of scientific and technological progress in my country's total agricultural output increased from 27% in 1972-1980 to 30% to 40% in 1981-1985.

  CnOpenData counts the number of registered agricultural industrial and commercial enterprises. According to the classification of national economic industries, statistics are divided into five categories using major categories (2-digit codes). The five categories are: Agricultural , forestry, animal husbandry, fishery professional and auxiliary activities; agriculture; forestry; fishery; animal husbandry. At the same time, statistics are compiled fromfour dimensionsto fully reflect the increase and development of agricultural enterprises in my countrysince 1950.


Data characteristics

  • Detailed statistics on the number of agricultural industrial and commercial registered enterprises in 363 cities and 2933 districts and counties corresponding to 31 provinces/municipalities/autonomous regions/special administrative regions in China;
  • Detailed statistics on industrial and commercial registration from 1950 to the present, with a long time span and a complete observation period;
  • Not only the number of new companies in each region and year was counted, but also the number of canceled companies was counted to obtain the number of surviving companies;
  • In accordance with the national economic industry classification standards, the five major categories under agriculture have been carefully classified;
  • Conduct statistics from two-dimensional, three-dimensional and four-dimensional perspectives, with rich fields and complete tables, covering the statistical needs of each dimension;

Data scale

Agricultural industrial and commercial registration enterprise information data-statistics by category


Time interval

1950-2021.12.31


Field display

Statistical table of two-dimensional information of agricultural industrial and commercial registered enterprises

Province-Year-Enterprise Quantity Information Table City-Year-Enterprise Quantity Information Table District and County-Annual-Enterprise Quantity Information Table Industry-Year-Enterprise Quantity Information Table Enterprise nature-annual-enterprise quantity information table
Fiscal year Fiscal year Fiscal year Fiscal year Fiscal year
Province Province Province Industry category Enterprise nature
Province code Province code Province code Category code Number of registered companies
Number of registered companies City City Industry categories Number of canceled companies
Number of canceled companies City code City code Major categories of codes Number of surviving enterprises
Number of surviving enterprises Number of registered companies Area Number of registered companies
Number of canceled companies Region code Number of canceled companies
Number of surviving enterprises Number of registered companies Number of surviving enterprises
Number of canceled companies
Number of surviving enterprises

Three-dimensional information statistics table of agricultural industrial and commercial registered enterprises

Province-Annual-Industry-Enterprise Quantity Information Table City-Year-Industry-Enterprise Quantity Information Table District and County-Annual-Industry-Enterprise Quantity Information Table Province-Year-Enterprise Nature-Enterprise Quantity Information Table City-Year-Enterprise Nature-Enterprise Quantity Information Table District and County-Year-Enterprise Nature-Enterprise Quantity Information Table
Fiscal year Fiscal year Fiscal year Fiscal year Fiscal year Fiscal year
Province Province Province Province Province Province
Province code Province code Province code Province code Province code Province code
Industry category City City Enterprise nature City City
Category code City code City code Number of registered companies City code City code
Industry categories Industry categories Area Number of canceled companies Enterprise nature Area
Major categories of codes Category code Region code Number of surviving enterprises Number of registered companies Region code
Number of registered companies Industry categories Industry category Number of canceled companies Enterprise nature
Number of canceled companies Major categories of codes Category code Number of surviving enterprises Number of registered companies
Number of surviving enterprises Number of registered companies Industry categories Number of canceled companies
Number of canceled companies Major categories of codes Number of surviving enterprises
Number of surviving enterprises Number of registered companies
Number of canceled companies
Number of surviving enterprises

Four-dimensional information statistics table of agricultural industrial and commercial registered enterprises

Province-Year-Industry-Enterprise Nature-Enterprise Quantity Information Table City-Year-Industry-Enterprise Nature-Enterprise Quantity Information Table District and County-Year-Industry-Enterprise Nature-Enterprise Quantity Information Table
Fiscal year Fiscal year Fiscal year
Province Province Province
Province code Province code Province code
Industry category City City
Category code City code City code
Industry categories Industry categories Area
Major categories of codes Category code Region code
Enterprise nature Industry categories Industry category
Number of registered companies Major categories of codes Category code
Number of canceled companies Enterprise nature Industry categories
Number of surviving enterprises Number of registered companies Major categories of codes
Number of canceled companies Enterprise nature
Number of surviving enterprises Number of registered companies
Number of canceled companies
Number of surviving enterprises

Sample data

Due to the large number of data tables, this page only displays secondary statistical tables. Please click on the left side to view the detailed data of each table.

Province-Year-Enterprise Quantity Information Table

Fiscal year Province Province code Number of registered companies Number of canceled companies Number of surviving enterprises
1981 Shanghai 31 1 1 1
1982 Shanghai 31 2 0 2
1983 Shanghai 31 1 1 3
1984 Shanghai 31 11 6 13
1985 Shanghai 31 9 8 16
1986 Shanghai 31 14 10 22
1987 Shanghai 31 13 10 25
1988 Shanghai 31 14 11 29
1989 Shanghai 31 106 65 124
1990 Shanghai 31 56 39 115
2004 Yunnan Province 53 634 322 2440
2005 Yunnan Province 53 628 336 2746
2006 Yunnan Province 53 713 254 3123
2007 Yunnan Province 53 939 272 3808
2008 Yunnan Province 53 1979 452 5515
2009 Yunnan Province 53 4369 626 9432
2010 Yunnan Province 53 4823 607 13629
1992 Inner Mongolia Autonomous Region 15 58 5 202
1993 Inner Mongolia Autonomous Region 15 61 10 258
1994 Inner Mongolia Autonomous Region 15 37 9 285
1995 Inner Mongolia Autonomous Region 15 52 16 328
1996 Inner Mongolia Autonomous Region 15 70 13 382
1997 Inner Mongolia Autonomous Region 15 120 28 489
1998 Inner Mongolia Autonomous Region 15 199 43 660
1999 Inner Mongolia Autonomous Region 15 184 42 801
2000 Inner Mongolia Autonomous Region 15 219 36 978
2020 Inner Mongolia Autonomous Region 15 22286 3672 133029
2021 Inner Mongolia Autonomous Region 15 11002 497 140359
1983 Beijing City 11 5 0 24
1984 Beijing City 11 14 0 38
1985 Beijing City 11 18 0 56
1986 Beijing City 11 19 0 75
1987 Beijing City 11 16 2 91
1988 Beijing City 11 16 2 105
1989 Beijing City 11 14 1 117
1990 Beijing City 11 15 1 131
1991 Beijing City 11 25 0 155
1992 Beijing City 11 144 0 299
1993 Beijing City 11 177 4 476
1994 Beijing City 11 95 2 567
1995 Beijing City 11 71 6 636
1996 Beijing City 11 93 7 723
1997 Beijing City 11 91 44 807
1998 Beijing City 11 163 44 926
1999 Beijing City 11 221 35 1103
2000 Beijing City 11 401 36 1469
2001 Beijing City 11 438 69 1871
2002 Beijing City 11 462 67 2264
2003 Beijing City 11 680 118 2877
2004 Beijing City 11 766 66 3525

City-Year-Enterprise Quantity Information Table

Fiscal year Province Province code City City code Number of registered companies Number of canceled companies Number of surviving enterprises
1997 Shanghai 31 Shanghai 3100 197 131 496
1998 Shanghai 31 Shanghai 3100 172 119 537
1999 Shanghai 31 Shanghai 3100 214 144 632
2000 Shanghai 31 Shanghai 3100 241 145 729
2001 Shanghai 31 Shanghai 3100 254 133 838
2002 Shanghai 31 Shanghai 3100 288 143 993
2003 Shanghai 31 Shanghai 3100 392 190 1242
2004 Shanghai 31 Shanghai 3100 413 159 1465
2005 Shanghai 31 Shanghai 3100 443 161 1749
1985 Yunnan Province 53 Lincang City 5309 1 0 1
1988 Yunnan Province 53 Lincang City 5309 1 0 2
1990 Yunnan Province 53 Lincang City 5309 1 0 3
1991 Yunnan Province 53 Lincang City 5309 2 0 5
1992 Yunnan Province 53 Lincang City 5309 1 0 6
1993 Yunnan Province 53 Lijiang City 5307 1 0 4
1995 Yunnan Province 53 Lijiang City 5307 1 0 5
1997 Yunnan Province 53 Lijiang City 5307 2 0 7
1998 Yunnan Province 53 Lijiang City 5307 4 0 11
1999 Yunnan Province 53 Lijiang City 5307 5 0 16
2000 Yunnan Province 53 Lijiang City 5307 6 0 22
2001 Yunnan Province 53 Lijiang City 5307 12 0 34
2002 Yunnan Province 53 Lijiang City 5307 4 0 38
2003 Yunnan Province 53 Lijiang City 5307 11 3 49
2005 Yunnan Province 53 Baoshan City 5305 22 13 162
2006 Yunnan Province 53 Baoshan City 5305 27 13 176
2007 Yunnan Province 53 Baoshan City 5305 27 3 190
2008 Yunnan Province 53 Baoshan City 5305 127 21 314
2009 Yunnan Province 53 Baoshan City 5305 249 27 542
2010 Yunnan Province 53 Baoshan City 5305 243 22 758
2011 Yunnan Province 53 Baoshan City 5305 352 15 1088
2012 Yunnan Province 53 Baoshan City 5305 512 34 1585
2013 Yunnan Province 53 Baoshan City 5305 565 36 2116
2000 Yunnan Province 53 Nujiang Lisu Autonomous Prefecture 5333 2 1 11
2001 Yunnan Province 53 Nujiang Lisu Autonomous Prefecture 5333 2 1 12
2002 Yunnan Province 53 Nujiang Lisu Autonomous Prefecture 5333 3 0 14
2003 Yunnan Province 53 Nujiang Lisu Autonomous Prefecture 5333 2 0 16
2004 Yunnan Province 53 Nujiang Lisu Autonomous Prefecture 5333 4 3 20
2005 Yunnan Province 53 Nujiang Lisu Autonomous Prefecture 5333 5 1 22
2006 Yunnan Province 53 Nujiang Lisu Autonomous Prefecture 5333 10 3 31
2007 Yunnan Province 53 Nujiang Lisu Autonomous Prefecture 5333 7 3 35
2008 Yunnan Province 53 Nujiang Lisu Autonomous Prefecture 5333 36 9 68
2021 Yunnan Province 53 Nujiang Lisu Autonomous Prefecture 5333 271 0 4780
2014 Yunnan Province 53 Wenshan Zhuang and Miao Autonomous Prefecture 5326 920 82 2236
2015 Yunnan Province 53 Wenshan Zhuang and Miao Autonomous Prefecture 5326 1139 130 3293
2016 Yunnan Province 53 Wenshan Zhuang and Miao Autonomous Prefecture 5326 1309 598 4472
2017 Yunnan Province 53 Wenshan Zhuang and Miao Autonomous Prefecture 5326 1431 321 5305
2018 Yunnan Province 53 Wenshan Zhuang and Miao Autonomous Prefecture 5326 1392 192 6376
2019 Yunnan Province 53 Wenshan Zhuang and Miao Autonomous Prefecture 5326 953 51 7137
2020 Yunnan Province 53 Wenshan Zhuang and Miao Autonomous Prefecture 5326 1839 24 8925
2021 Yunnan Province 53 Wenshan Zhuang and Miao Autonomous Prefecture 5326 536 0 9437

District and County-Year-Enterprise Quantity Information Table

Fiscal year Province Province code City City code Area Region code Number of registered companies Number of canceled companies Number of surviving enterprises
2012 上海市 31 上海市 3100 嘉定区 310114 79 18 622
2013 上海市 31 上海市 3100 嘉定区 310114 72 7 676
2014 上海市 31 上海市 3100 嘉定区 310114 50 7 719
2015 上海市 31 上海市 3100 嘉定区 310114 83 12 795
2016 上海市 31 上海市 3100 嘉定区 310114 17 2 800
1989 上海市 31 上海市 3100 奉贤区 310120 16 8 16
2006 上海市 31 上海市 3100 奉贤区 310120 33 6 207
2007 上海市 31 上海市 3100 奉贤区 310120 66 12 267
2008 上海市 31 上海市 3100 奉贤区 310120 62 4 317
2009 上海市 31 上海市 3100 奉贤区 310120 75 4 388
2010 上海市 31 上海市 3100 奉贤区 310120 60 8 444
2011 上海市 31 上海市 3100 奉贤区 310120 82 7 518
2012 上海市 31 上海市 3100 奉贤区 310120 115 9 626
2007 上海市 31 上海市 3100 宝山区 310113 32 5 132
2008 上海市 31 上海市 3100 宝山区 310113 25 6 152
2009 上海市 31 上海市 3100 宝山区 310113 16 7 162
2010 上海市 31 上海市 3100 宝山区 310113 13 1 168
2011 上海市 31 上海市 3100 宝山区 310113 39 6 206
2012 上海市 31 上海市 3100 宝山区 310113 12 4 212
2013 上海市 31 上海市 3100 宝山区 310113 22 5 230
2010 云南省 53 临沧市 5309 临翔区 530902 51 2 106
2011 云南省 53 临沧市 5309 临翔区 530902 151 2 255
2012 云南省 53 临沧市 5309 临翔区 530902 176 6 429
2013 云南省 53 临沧市 5309 临翔区 530902 216 20 639
2014 云南省 53 临沧市 5309 临翔区 530902 394 21 1013
2015 云南省 53 临沧市 5309 临翔区 530902 410 22 1402
2016 云南省 53 临沧市 5309 临翔区 530902 436 39 1816
1990 云南省 53 大理白族自治州 5329 洱源县 532930 1 0 1
1999 云南省 53 大理白族自治州 5329 洱源县 532930 1 0 2
2000 云南省 53 大理白族自治州 5329 洱源县 532930 2 0 4
2002 云南省 53 大理白族自治州 5329 洱源县 532930 1 0 5
2003 云南省 53 大理白族自治州 5329 洱源县 532930 2 1 7
2004 云南省 53 大理白族自治州 5329 洱源县 532930 1 0 7
2005 云南省 53 大理白族自治州 5329 洱源县 532930 2 0 9
2006 云南省 53 大理白族自治州 5329 洱源县 532930 1 0 10
2007 云南省 53 大理白族自治州 5329 洱源县 532930 3 1 13
2009 云南省 53 大理白族自治州 5329 洱源县 532930 14 0 26
2010 云南省 53 大理白族自治州 5329 洱源县 532930 18 1 44
2011 云南省 53 大理白族自治州 5329 洱源县 532930 46 2 89
2012 云南省 53 大理白族自治州 5329 洱源县 532930 47 0 134
2013 云南省 53 大理白族自治州 5329 洱源县 532930 50 0 184
2014 云南省 53 大理白族自治州 5329 洱源县 532930 95 1 279
2015 云南省 53 大理白族自治州 5329 洱源县 532930 110 6 388
2016 云南省 53 大理白族自治州 5329 洱源县 532930 137 9 519
2017 云南省 53 大理白族自治州 5329 洱源县 532930 130 5 640
1994 云南省 53 大理白族自治州 5329 漾濞彝族自治县 532922 1 0 1
2000 云南省 53 大理白族自治州 5329 漾濞彝族自治县 532922 1 0 2
2002 云南省 53 大理白族自治州 5329 漾濞彝族自治县 532922 2 0 4
2003 云南省 53 大理白族自治州 5329 漾濞彝族自治县 532922 2 2 6
2004 云南省 53 大理白族自治州 5329 漾濞彝族自治县 532922 1 0 5

Industry-Year-Enterprise Quantity Information Table

Fiscal year Industry categories Category code Industry categories Major categories of code Number of registered companies Number of canceled companies Number of surviving enterprises
1960 农、林、牧、渔业 A 农、林、牧、渔专业及辅助性活动 "05 " 1 0 15
1961 农、林、牧、渔业 A 农、林、牧、渔专业及辅助性活动 "05 " 2 0 17
1962 农、林、牧、渔业 A 农、林、牧、渔专业及辅助性活动 "05 " 3 0 20
1964 农、林、牧、渔业 A 农、林、牧、渔专业及辅助性活动 "05 " 1 0 21
1968 农、林、牧、渔业 A 农、林、牧、渔专业及辅助性活动 "05 " 1 0 22
1969 农、林、牧、渔业 A 农、林、牧、渔专业及辅助性活动 "05 " 2 0 24
1970 农、林、牧、渔业 A 农、林、牧、渔专业及辅助性活动 "05 " 3 0 27
1971 农、林、牧、渔业 A 农、林、牧、渔专业及辅助性活动 "05 " 1 0 28
2004 农、林、牧、渔业 A 农业 "01 " 9097 3871 43425
2005 农、林、牧、渔业 A 农业 "01 " 9527 3124 49081
2006 农、林、牧、渔业 A 农业 "01 " 11065 3110 57022
2007 农、林、牧、渔业 A 农业 "01 " 22581 3715 76493
2018 农、林、牧、渔业 A 农业 "01 " 268541 33764 2135736
2019 农、林、牧、渔业 A 农业 "01 " 283852 69862 2385824
2001 农、林、牧、渔业 A 林业 "02 " 1085 416 6920
2002 农、林、牧、渔业 A 林业 "02 " 1580 411 8084
2003 农、林、牧、渔业 A 林业 "02 " 2200 593 9873
2004 农、林、牧、渔业 A 林业 "02 " 2243 606 11523
2005 农、林、牧、渔业 A 林业 "02 " 2517 600 13434
2006 农、林、牧、渔业 A 林业 "02 " 3105 774 15939
2007 农、林、牧、渔业 A 林业 "02 " 4283 842 19448
2008 农、林、牧、渔业 A 林业 "02 " 5900 845 24506
2009 农、林、牧、渔业 A 林业 "02 " 9261 913 32922
2003 农、林、牧、渔业 A 渔业 "04 " 1393 724 8394
2004 农、林、牧、渔业 A 渔业 "04 " 1488 790 9158
2005 农、林、牧、渔业 A 渔业 "04 " 1993 503 10361
2006 农、林、牧、渔业 A 渔业 "04 " 2262 520 12120
2007 农、林、牧、渔业 A 渔业 "04 " 3447 637 15047
2008 农、林、牧、渔业 A 渔业 "04 " 5683 617 20093
2009 农、林、牧、渔业 A 渔业 "04 " 8776 680 28252
2010 农、林、牧、渔业 A 渔业 "04 " 9548 713 37120
2011 农、林、牧、渔业 A 渔业 "04 " 13693 777 50100
2012 农、林、牧、渔业 A 渔业 "04 " 18146 690 67469
2013 农、林、牧、渔业 A 渔业 "04 " 26469 723 93248
2014 农、林、牧、渔业 A 渔业 "04 " 27589 958 120114
1983 农、林、牧、渔业 A 畜牧业 "03 " 17 1 141
1984 农、林、牧、渔业 A 畜牧业 "03 " 97 6 237
1985 农、林、牧、渔业 A 畜牧业 "03 " 75 8 306
1986 农、林、牧、渔业 A 畜牧业 "03 " 78 11 376
1987 农、林、牧、渔业 A 畜牧业 "03 " 98 22 463
1988 农、林、牧、渔业 A 畜牧业 "03 " 165 33 606
1989 农、林、牧、渔业 A 畜牧业 "03 " 411 80 984
1990 农、林、牧、渔业 A 畜牧业 "03 " 338 64 1242
1991 农、林、牧、渔业 A 畜牧业 "03 " 259 59 1437
1992 农、林、牧、渔业 A 畜牧业 "03 " 529 124 1907
1993 农、林、牧、渔业 A 畜牧业 "03 " 807 222 2590
1994 农、林、牧、渔业 A 畜牧业 "03 " 663 164 3031
1995 农、林、牧、渔业 A 畜牧业 "03 " 865 261 3732
1996 农、林、牧、渔业 A 畜牧业 "03 " 885 306 4356
1997 农、林、牧、渔业 A 畜牧业 "03 " 1234 431 5284

Enterprise nature-annual-enterprise quantity information table

Fiscal year Nature of the business Number of registered companies Number of canceled companies Number of surviving enterprises
2003 Individual industrial and commercial households 3932 23 11467
2004 Individual industrial and commercial households 5607 48 17051
2005 Individual industrial and commercial households 6887 45 23890
2006 Individual industrial and commercial households 9403 37 33248
2007 Individual industrial and commercial households 14867 70 48078
2008 Individual industrial and commercial households 24887 171 72895
2009 Individual industrial and commercial households 42318 349 115042
2010 Individual industrial and commercial households 58150 505 172843
1985 Public Institution 23 2 59
1986 Public Institution 11 1 68
1987 Public Institution 27 2 94
1988 Public Institution 271 4 363
1989 Public Institution 156 24 515
1990 Public Institution 155 25 646
1991 Public Institution 157 33 778
1992 Public Institution 297 35 1042
1993 Public Institution 381 65 1388
1994 Public Institution 249 87 1572
1995 Public Institution 322 174 1807
1996 Public Institution 221 214 1854
1974 State-owned enterprises 1 0 20
1976 State-owned enterprises 1 0 21
1977 State-owned enterprises 1 0 22
1978 State-owned enterprises 5 0 27
1979 State-owned enterprises 4 0 31
1980 State-owned enterprises 18 2 49
1981 State-owned enterprises 19 0 66
1982 State-owned enterprises 23 0 89
1983 State-owned enterprises 5 1 94
1984 State-owned enterprises 19 1 112
1980 Foreign-invested enterprises 4 0 -11
1981 Foreign-invested enterprises 5 0 -6
1982 Foreign-invested enterprises 9 0 3
1983 Foreign-invested enterprises 7 0 10
1984 Foreign-invested enterprises 56 5 66
1985 Foreign-invested enterprises 70 8 131
1986 Foreign-invested enterprises 53 9 176
2001 Private enterprises 9960 6981 50634
2002 Private enterprises 11785 6349 55438
2003 Private enterprises 13888 8053 62977
2004 Private enterprises 13882 6917 68806
2005 Private enterprises 15487 5560 77376
2008 Collectively owned enterprises 369 585 10543
2009 Collectively owned enterprises 392 434 10350
2010 Collectively owned enterprises 170 378 10086
2011 Collectively owned enterprises 137 405 9845
2012 Collectively owned enterprises 144 457 9584
2013 Collectively owned enterprises 136 214 9263
2014 Collectively owned enterprises 163 182 9212
2015 Collectively owned enterprises 367 186 9397

Data update frequency

Annual Update

文件下载